Many runners are willing to drop anywhere from $250 to over $1,000 on top-tier GPS watches: from mainstream hitters like the Garmin Forerunner 165 / 265 (see Forerunner 165 review or FR 265 vs 965 comparison), the battery-beast Coros Pace 3 (COROS Pace 3 review), the versatile Apple Watch Ultra (Apple Watch Ultra for runners review), or the rugged off-road machine, the Suunto Race.
Yet, there’s an incredible paradox: over 90% of runners only glance at three metrics after a run: Time, Distance, and Avg Pace.
After hitting stop and syncing to Strava to chase kudos, you leave dozens of complex charts and graphs behind. You ignore the Training Status: Unproductive warning, don’t understand why your HRV Status suddenly plummeted, and grit your teeth through a grueling 400m interval session while your body is screaming for rest. The inevitable result: Overtraining, burnout, Achilles tendonitis, IT Band syndrome, or grinding for a year only to find your pace is still stuck.
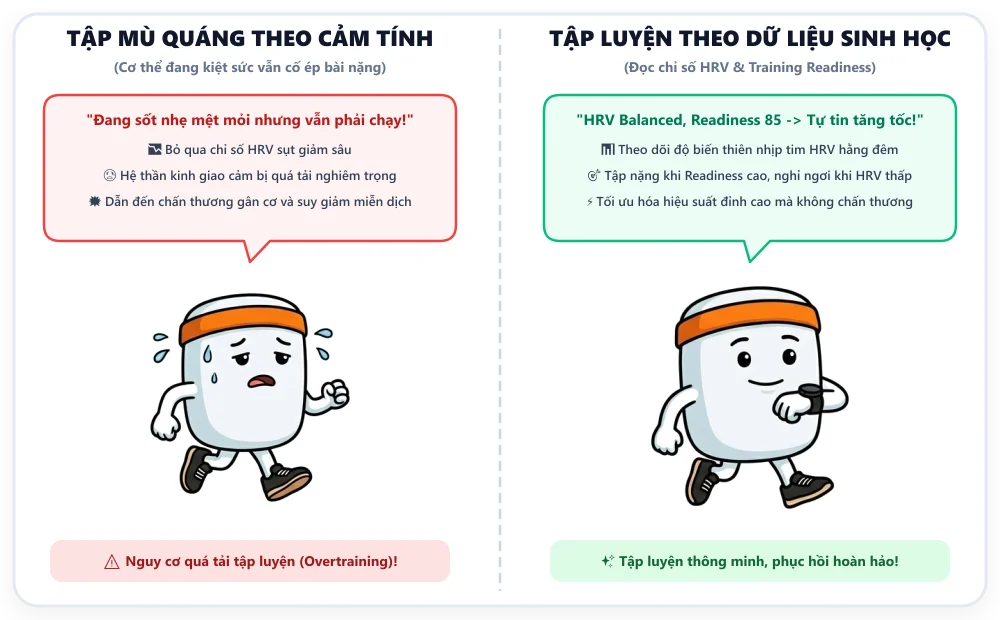
+-------------------------------------------------------------------------+
|                  THE DIFFERENCE BETWEEN TWO TYPES OF RUNNERS            |
+-------------------------------------------------------------------------+
|  [The 90% Casual Runner]             [The 10% Science-Backed Runner]    |
|  - Only looks at: Time, Dist, Pace   - Reads: HRV, ACWR, Readiness Score|
|  - Intuitive: "Feel good, go hard"    - Scientific: "Data dictates intensity"|
|  - Common: Overtraining, injury      - Outcome: Peak performance (PRs)  |
+-------------------------------------------------------------------------+
Your sports watch isn’t just a glorified odometer; it’s a miniature Sports Biometrics Lab. This article breaks down the “Bio-Power Quartet”: HRV, Training Load (ACWR), VO2Max, and Training Readiness, helping you turn raw data into a lever for peak performance and long-term injury prevention.
1. Deconstructing the 4 Vital Biometric Metrics on Your Running Watch
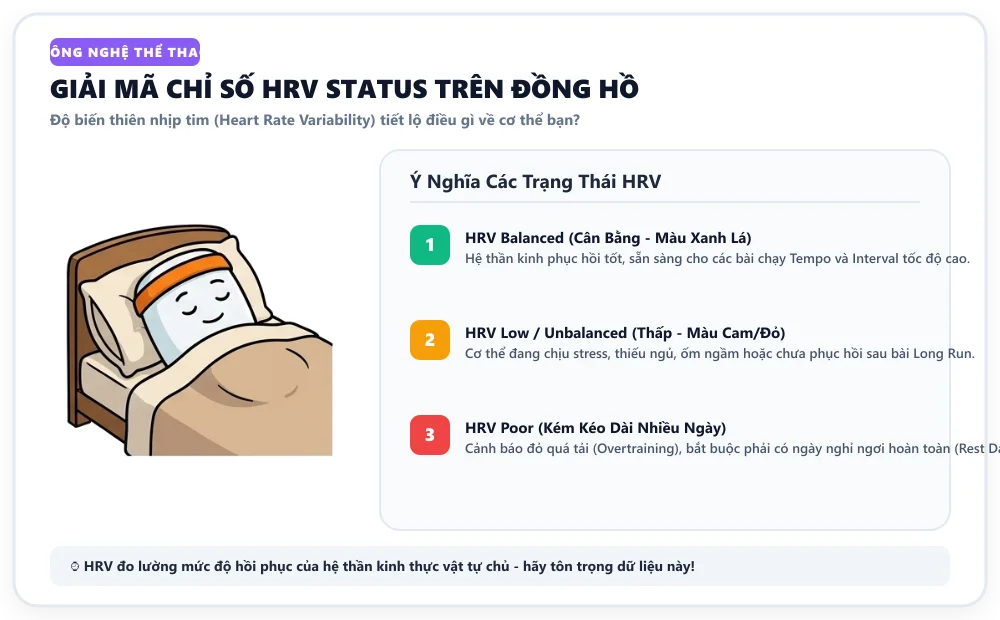 Graphic: A balanced green HRV status is proof your nervous system is primed for intensity.
To master your gear, you first need to understand the biological signals your body sends through your wrist.
1.1. HRV (Heart Rate Variability): A Window into the Autonomic Nervous System
Many assume a healthy heart beats like a metronome—exactly 60 bpm means a beat every 1.0 seconds. Medical reality is the exact opposite!
The time gap between consecutive beats (R-R interval) changes by milliseconds (ms) constantly:
- Beat 1 to 2:
0.93 seconds(930 ms) - Beat 2 to 3:
1.08 seconds(1080 ms) - Beat 3 to 4:
0.97 seconds(970 ms)
This micro-fluctuation is Heart Rate Variability (HRV), usually calculated using the rMSSD (Root Mean Square of Successive Differences) algorithm during your sleep cycle.
                  AUTONOMIC NERVOUS SYSTEM (ANS) CONTROL
                  ========================================
                                    +--------------+
                                    | BRAIN & CNS  |
                                    +-------+------+
                                            |
                  +-------------------------+-------------------------+
                  |                                                   |
                  v                                                   v
     [SYMPATHETIC NERVOUS SYSTEM]                      [PARASYMPATHETIC NS]
          "Fight or Flight"                                    "Rest & Digest"
     - Triggered by: Hard efforts, stress,             - Triggered by: Deep sleep, meditation,
       alcohol, inflammation, sickness                 relaxation, recovery
     - Effect: Adrenaline release, rapid,              - Effect: Vagus nerve stimulation,
       rigid heart rhythm                              creates flexibility between beats
                  |                                                   |
                  v                                                   v
         ==> HRV PLUMMETS (LOW)                              ==> HRV INCREASES / STABLE
     (Stressed, needs recovery)                       (Ready for heavy load)
Why is higher HRV better?
HRV results from a constant tug-of-war between the two branches of your Autonomic Nervous System (ANS):
- Sympathetic (SNS): The gas pedal. When you sprint, face a deadline, or have a few beers, the SNS dominates, forcing a rigid, steady beat to pump blood under “stress.” HRV drops.
- Parasympathetic (PNS): The brake. Triggered by the Vagus nerve, this system slows the heart and adds flexibility between beats. HRV rises or remains stable.
Red Alert: If your nightly HRV stays below your baseline for 2-3 consecutive days, that’s a red flag: you’re dealing with cumulative Overreaching, unhealed muscle inflammation, or your immune system is fighting off a virus. Never run an interval session when HRV is Unbalanced or Low!
The Golden Rule: Personalized Baseline (Stop Comparing)
A classic mistake is comparing your HRV to a training partner’s: “Why is your HRV 85ms and mine only 42ms? Is my heart weak?”
Absolutely not! HRV is biologically unique:
- Influenced by genetics, age (HRV declines with age), heart size, and sex.
- A 45-year-old pro might have a baseline of 45 - 55 ms.
- A 22-year-old inactive person might have 70 - 80 ms.
- Watches (Garmin/Coros/Apple) need you to wear them while sleeping for at least 21 days to establish your “green” range. As long as you stay within your own range, you are in a healthy state of balance.
1.2. Training Load & The ACWR Model: Science-Based Fitness Progression
Training Load measures the cumulative impact of exercise on your cardiovascular and musculoskeletal systems. It is typically calculated via EPOC (Excess Post-exercise Oxygen Consumption).
To prevent injury while increasing volume, top sports scientists (led by Dr. Tim Gabbett) developed the ACWR (Acute:Chronic Workload Ratio) model:
                            ACWR RATIO MODEL
     Acute Load (7 days) / Chronic Load (28 days)

  ACWR Ratio
     ^
 2.0 |                                         [DANGER ZONE]
     |                                    (Injury risk x3-x5)
 1.5 +------------------------------------------------------------------+
     |                                    / Overreaching zone /
 1.3 +------------------------------------------------------------------+
     |        [SWEET SPOT]                / Safe Fitness Gains /
 0.8 +------------------------------------------------------------------+
     |        [UNDER-TRAINING]            / Detraining /
 0.0 +------------------------------------------------------------------> Time
Interpreting ACWR ratios:
- Below 0.8 (Under-training): You’re training too little to maintain your current fitness.
- 0.8 - 1.3 (The Sweet Spot): The ideal range. Increases are sustainable (max 10% per week), stimulating cardiovascular growth without overloading connective tissues.
- 1.3 - 1.5 (Overreaching): Load is increasing quickly. Acceptable for a short Peak Week, but requires a recovery week immediately after.
- Above 1.5 (Danger Zone): Risk of muscle tears, Plantar Fasciitis, patellar tendonitis, or Stress Fractures increases 3 to 5 times.
1.3. VO2Max: The Truth Behind the Algorithm
VO2 Max (in ml/kg/min) is the maximum amount of oxygen your body can utilize per minute per kg of body weight. Think of it as the “engine displacement” of your running engine.
How does your watch estimate it?
Algorithms analyze the correlation between GPS Pace and Heart Rate intensity on flat terrain. If you maintain the same pace (e.g., 5:00 min/km) while your average heart rate drops from 160 bpm to 150 bpm, the watch assumes a VO2Max improvement.
+---------------------------------------------------------------------------+
|               4 FACTORS THAT DISTORT VO2MAX ON WATCHES                    |
+---------------------------------------------------------------------------+
| 1. Wrong Weight: If you gain 3kg and don't update it, the math breaks.      |
| 2. Heat: Running at noon in 36°C heat spikes HR by 10-15 bpm to cool skin.  |
| 3. Trails/Hills: Steep climbs spike HR but slow pace = lower score.        |
| 4. Cadence Lock: Watch mistakes step cadence for heart rate.               |
+---------------------------------------------------------------------------+
1.4. Training Readiness: When to Push?
Training Readiness (Garmin) or Energy Index (Coros) is a dynamic score generated from 6 data points:
- Sleep Score: Quality of Deep/REM sleep.
- HRV Status: Autonomic system recovery.
- Sleep History: Cumulative sleep debt (3-5 days).
- Stress History: Daily allostatic load.
- Recovery Time: Countdown to full repair.
- Acute Load: Current weekly training volume.
2. Decision Matrix: Data to Training Plan
+-----------------------------------------------------------------------------------------------------+
|                      RUNNER'S DECISION MATRIX                                                       |
+----------------------+--------------------+--------------------+------------------------------------+
| HRV STATUS           | READINESS          | ACWR (LOAD)        | ACTION                             |
+----------------------+--------------------+--------------------+------------------------------------+
| Balanced             | High (75-100)      | Optimal (0.8-1.3)  | 🟢 "GREEN LIGHT": Intervals/Tempo  |
+----------------------+--------------------+--------------------+------------------------------------+
| Balanced             | Mid (50-74)        | Optimal            | 🟡 BASE RUN: Easy effort (Zone 2)  |
+----------------------+--------------------+--------------------+------------------------------------+
| Low / Unbalanced     | Low (<50)          | High (>1.4)        | 🔴 "RED LIGHT": Rest or Active Rec |
+----------------------+--------------------+--------------------+------------------------------------+
3. Brand Ecosystem Comparison
| Feature | Garmin Connect | Coros Training Hub | Apple Watch (w/ Apps) | Suunto App |
|---|---|---|---|---|
| HR Sensor Accuracy | Very High | High | Best in Class | Good |
| HRV Tracking | Nightly Baseline | Nightly + Manual Test | Requires AFib settings | Nightly |
| Web Interface | Good | Excellent (Free) | N/A (Third party) | Minimalist |
| Battery Life | 7 - 23 days | 14 - 30 days | 2 - 3 days | 12 - 26 days |
5 Common Data Reading Mistakes
- Becoming a “Slave to the Algorithm”: If you feel good but the watch says “Readiness 45,” prioritize your RPE (Rate of Perceived Exertion) over the screen.
- Using “220-Age”: This outdated formula creates massive inaccuracies in your training zones. Use a heart rate field test instead.
- Loose Fit: Poor wrist contact causes “Cadence Lock” (measuring steps instead of heart rate).
- “Calorie Compensation”: Watches overestimate burned calories by 15-25%. Don’t eat back calories you haven’t actually burned.
- Comparing HRV: HRV is personal. Don’t compare yours to others.
Conclusion
A high-end watch won’t turn you into a pro. Its true value lies in helping you look inward, turning vague fatigue into precise, actionable data.
When you respect your biometric signals, you know exactly when to push the gas and when to hit the brakes. Let your watch be your consultant, but let your heart and legs be the masters of your journey.
